App Development

Modern Workplace Summit – Digital Transformation for Modern Workplace Evolution

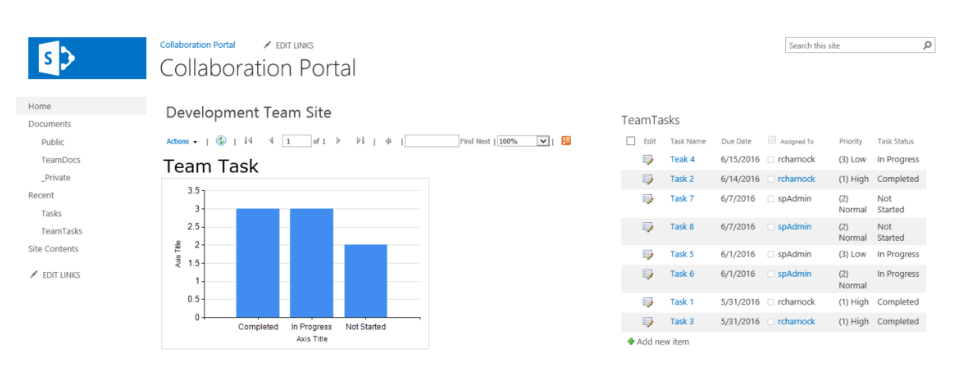
At this year's Modern Workplace Summit business leaders discussed real-life scenarios where their organizations are achieving their overall business strategy and positively impacting their ability to achieve business goals when innovation and timing were crucial. Red Level invited three Michigan-based national and multi-national corporations to share their digital transformation experiences during the opening panel. Our morning panelists discussed Digital Transformation, how the pandemic changed everything from IT roadmaps to getting into the cloud as quickly as possible, and tech solutions that worked for three very different companies with unique IT challenges. VIEW THE MODERN WORKPLACE SUMMIT HERE   Real-World Case Studies of Modern Workplace Evolution: Keynote Panel Discussion During the panel discussion, several elements of Digital Transformation recurred throughout the morning: being proactive and nimble, understanding that your technologies may not mirror your customers’, security, making do with reduced IT staff, and getting internal buy-in. With Moderator David King, ...

2023-02-16T16:01:18+00:00

Use Report Builder 2012 to Visualize Your SharePoint Data

Quick and Dirty Reporting for SharePoint 2013 Applications - Part 1 Good restaurants are hard to come by. The combination of tasty food, atmosphere, price, and service is a mix many owners never master. The same is true in using SharePoint as a platform to develop a department sized application. Microsoft Access, Excel and Lotus notes have traditionally played in this “no-code” space. However, SharePoint offers: tables, forms, a workflow engine, but lacks a little in the reporting area. A simple tool I have been using to resolve this shortcoming is Microsoft SQL Server 2012 Report Builder (you can download it for free here). Report Builder is a free graphics interface tool that visualizes data in table or chart formats. Report Builder can connect to numerous data sources, but what I like about it is that a SharePoint list is one of them. One of the core benefits of this ...

2023-02-16T16:01:29+00:00

Top 5 Software Development Trends in 2019

In the world of software development, you’ve likely heard a lot of fancy terms; machine learning, Artificial Intelligence, Internet of Things, Virtual Reality, the list goes on and on. But how many of those have been proven to last and will remain impactful to us in 2019? Let’s take a look what’s here to stay in 2019 and how they may affect you. 1. Big Data is Just Data Now Big data was a hot topic a while back. But, it’s no longer, “hey, big data is coming.” The notion now is “bigger data is here.” What used to be constrained as too much data to process is all possible now thanks to cloud providers. Data is now decentralized from the local server and in the cloud, which provides a better disaster recovery plan and greater computing power for processing the data. From a business perspective, data has become a ...

2023-02-16T16:01:30+00:00

Pérez Art Museum Miami Improves Its Exhibition Planning and Management Platform

Pérez Art Museum Miami (PAMM) has chosen Curia, the first collaborative exhibition planning application, to serve as its exhibition planning and management system. With this step, PAMM joins other prestigious museums such as the Detroit Institute of Arts and the John Michael Kohler Arts Center in using Curia to support exhibition planning and development activities. Curia is the only application devoted specifically to exhibition planning, design, and task management. The system enables exhibition planners to enter, retain, and modify all data and media associated with an exhibition, generate planning documents and reports, assign and manage tasks, deploy and modify timelines and easily perform other necessary tasks which have proven cumbersome using traditional spreadsheets and email chains. As a cloud-based system, Curia provides all exhibition stakeholders with an always-accessible shared working environment and a “single point of truth” for complex and changeable data. The Curia system interfaces with PAMM’s TMS collection ...

2023-02-16T16:01:34+00:00

John Michael Kohler Arts Center Transforms Its Exhibition Planning Process

The John Michael Kohler Arts Center in Sheboygan, Wisconsin, has selected C/D/H’s, now Red Level innovative Curia exhibition planning system as its platform of choice for exhibition planning, development, and management. The Arts Center joins the Detroit Institute of Arts in harnessing Curia to streamline the exhibition planning process using Curia’s centralized “single point of truth” system, allowing all personnel involved in the planning and staging process to work within a single unified framework. Developed in cooperation with the Detroit Institute of Arts, the cloud-based Curia system is the only application devoted specifically to exhibition planning, design, and task management. The system integrates with museums’ collection management systems, enabling exhibition planners to easily integrate existing museum assets into exhibition-specific plans and documents. By replacing countless spreadsheets and other planning documents with a single unified information framework, Curia facilitates collaboration, knowledge transfer, and version control for planners, enabling exhibitions to be planned ...

2023-02-16T16:01:36+00:00

Use Report Builder 2012 to Visualize Your SharePoint Data Part 2

Quick and Dirty Reporting for SharePoint 2013 Applications - Part 2 Last week I shared with you how to build a report with Microsoft SQL Server 2012 Report Builder. This week we will dive into how to get these reports to display in your SharePoint environment. Part 2: Display the report in the SharePoint Navigate to a library within your SharePoint site. It can really be anywhere users who have access to the report data also have access. I like to use a library within the site where the source data is stored. Upload the report you just created and saved locally. Click the button: Open For a quick test, click on the report that just got uploaded. It should open and display live data. Note: this might be good enough, however you can also display it in a part of a page through a web part. Click the breadcrumb link to ...

2023-02-16T16:01:39+00:00