Quick and Dirty Reporting for SharePoint 2013 Applications – Part 2
Last week I shared with you how to build a report with Microsoft SQL Server 2012 Report Builder. This week we will dive into how to get these reports to display in your SharePoint environment.
Part 2: Display the report in the SharePoint
- Navigate to a library within your SharePoint site. It can really be anywhere users who have access to the report data also have access. I like to use a library within the site where the source data is stored.
- Upload the report you just created and saved locally.

- Click the button: Open
- For a quick test, click on the report that just got uploaded. It should open and display live data.

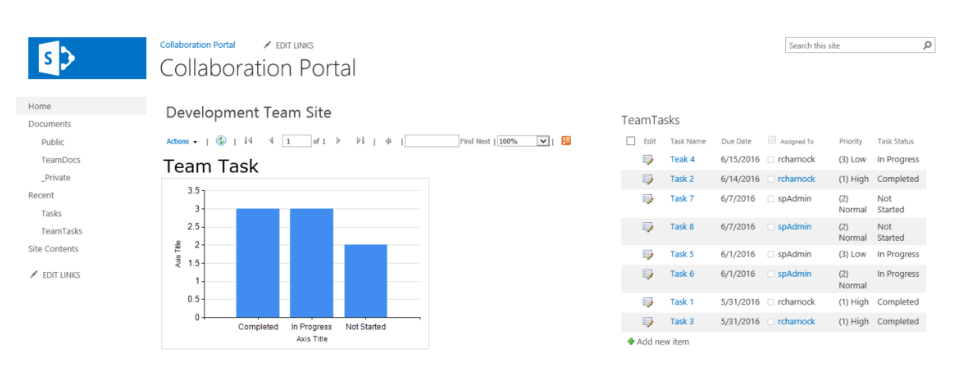
- Note: this might be good enough, however you can also display it in a part of a page through a web part.
- Click the breadcrumb link to access the document library: In my case Documents
- Note: the library displays the report.
- Navigate to the page you would like to display the web part in
- Click the button: Settings
- Click the option: Edit Page
- Insert your cursor where you want to insert the chart
- Click the ribbon tab: Insert
- Click the ribbon button: Web Part
- Click the category: SQL Server Reporting
- Click the button: Add
- Note: the Report Viewer web part is inserted into the page, but is not configured. There is still work to be done.
- Click the web part configuration drop-down arrow in the upper left corner
- Click the option: Edit Web part
- Click the build button which has the ellipses (three dots)
- Navigate and select the report you just uploaded
- Click the button: Ok
- Note: you are now looking at the page with the web part configuration pane. Click the ok button on the side web part configuration pane.
- Click the ribbon button: Save and Close
- Now you’re done!
- Note: as new entries are added to the list they will show in the report on a new page load. Happy reporting.
Conclusion:
SharePoint is a great platform, enabling users to create applications that have been traditionally done in desktop applications like MS Access, Excel, or Lotus Notes. SharePoint comes with the needed tools for tables, forms, and processing but, the ability to do reporting is left to tabular views with no core charting tool. Microsoft SQL Server Report Builder is easy to use to fill that gap. With a simple install, farm configuration, and advanced end-user skills. Real-time, self-updating charts, and graphs can apart of your standard SharePoint applications.
Reference:
To learn more about how to use Report build builder more Microsoft has a great help and walk through at: Report Builder in SQL Server 2016
To learn how to configure your SharePoint 2013 Farm to enable the use of Report Builder reports, complete steps 1-3 in the following article: Install The First Report Server in SharePoint Mode
For more information about gaining a competitive advantage with digital transformation, contact Red Level today.
Related Posts
At this year's Modern Workplace Summit business leaders discussed real-life ...
I have been involved in the technology industry, in the ...
Sometimes technology makes some scenarios worse. At our last Nintex ...


Did You Know?
Red Level has been chosen to receive the 2018 Michigan Works! Impact Award. The company was nominated for the honor by the Oakland County Michigan Works! Chapter in recognition of its success in forming strategic partnerships to upskill and expand the local workforce to meet industry needs better.